
When working with databases, writing a query is only half the battle. Understanding how that query actually executes is crucial for optimizing performance and building efficient applications. This is where SQL execution plans come into play—they're your window into the database engine's decision-making process.
What is an Execution Plan?
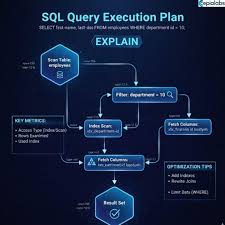
An execution plan is essentially a roadmap that shows how the database engine processes your SQL query. Think of it like a recipe: it breaks down the query into discrete steps, showing the order of operations, which indexes are used, how tables are joined, and the estimated cost of each operation.
The database query optimizer generates this plan by analyzing multiple possible strategies and selecting what it believes to be the most efficient approach based on statistics about your data, available indexes, and system resources.
Why Execution Plans Matter
Performance issues in database applications often stem from inefficient queries rather than hardware limitations. A query that takes seconds instead of milliseconds can cripple an application's responsiveness. Execution plans help you identify bottlenecks like table scans on large tables, missing indexes, inefficient join strategies, or outdated statistics that lead the optimizer astray.
By examining execution plans, you can transform a query from unusable to lightning-fast, often with minor adjustments to indexes or query structure.
Types of Execution Plans
There are two primary types of execution plans you'll encounter:
Estimated Execution Plans show what the optimizer predicts will happen without actually running the query. These are generated quickly and are useful for examining query structure without the overhead of execution. However, they're based on statistics and assumptions that may not reflect reality.
Actual Execution Plans capture what really happened during query execution. These include actual row counts, execution times, and resource usage. While they require running the query, they provide the truth about performance and can reveal discrepancies between what the optimizer predicted and what actually occurred.
How to View Execution Plans
The method varies by database system, but most provide straightforward ways to access plans:
In SQL Server, you can prefix your query with SET SHOWPLAN_ALL ON or use SQL Server Management Studio's "Display Estimated Execution Plan" and "Include Actual Execution Plan" buttons. These generate graphical representations that are intuitive to read.
PostgreSQL users can add EXPLAIN before any query to see the plan, or EXPLAIN ANALYZE to get the actual execution plan with timing information. The output is text-based but highly detailed.
MySQL offers the EXPLAIN keyword similarly, showing information about table access methods and join types. Oracle provides EXPLAIN PLAN FOR followed by your query, with results viewable through specific system tables.
Reading an Execution Plan
Execution plans can seem overwhelming at first, but they follow logical patterns. Operations are typically displayed hierarchically, either top-to-bottom or left-to-right depending on your tool. The query optimizer processes operations in a specific order, often from the innermost operations outward.
Each operation in the plan includes valuable information: the operation type (like Index Seek, Table Scan, or Hash Join), estimated and actual row counts, estimated cost (usually shown as a percentage of the total query cost), and details about which objects (tables, indexes) are involved.
Common Operations You'll Encounter
Table Scan means the database reads every row in a table sequentially. This is expensive for large tables and often indicates a missing index. While acceptable for small tables, it's a red flag for tables with thousands or millions of rows.
Index Scan reads all entries in an index, which is typically faster than a table scan but still processes more data than necessary. It suggests the index exists but isn't being used optimally.
Index Seek is what you want to see—the database uses an index to jump directly to relevant rows. This is highly efficient and indicates good index utilization.
Nested Loop Join processes one row from the outer table and finds matching rows in the inner table, repeating for each outer row. This works well when the outer table is small or when good indexes exist on the join columns.
Hash Join builds a hash table from one input and probes it with the other. This is efficient for large datasets without suitable indexes.
Merge Join requires both inputs to be sorted on the join keys, then merges them together. This is very efficient when data is already sorted or when indexes provide sorted output.
Key Metrics to Monitor
The cost estimate represents the optimizer's prediction of resource usage. Higher percentages indicate operations consuming more resources relative to the total query. Focus optimization efforts on the highest-cost operations.
Row counts reveal how many rows each operation processes. Large discrepancies between estimated and actual counts suggest outdated statistics, which can lead the optimizer to choose poor strategies.
I/O statistics show how much data is read from disk versus memory. High physical reads indicate the query is hitting disk frequently, suggesting opportunities for better indexing or memory configuration.
Practical Optimization Strategies
When you identify a table scan on a large table, adding an appropriate index often provides dramatic improvement. The index should cover the columns in your WHERE clause, JOIN conditions, and ideally your SELECT columns too.
If the optimizer chooses a plan different from what you expect, updating statistics can help. Statistics become stale as data changes, causing the optimizer to make decisions based on outdated information. Most databases provide commands to update statistics manually or can be configured to update them automatically.
Sometimes rewriting the query itself produces better results. Breaking complex queries into smaller steps with temporary tables, reformulating subqueries as joins, or using common table expressions can all influence the execution plan positively.
Advanced Considerations
Query hints allow you to override the optimizer's decisions when you have specific knowledge it lacks. However, use these sparingly—they can backfire when data patterns change, and they prevent the optimizer from adapting to new conditions.
Parameter sniffing occurs when the optimizer creates a plan based on the first parameter values it sees, which may not be optimal for other values. This can cause the same query to perform differently with different parameters.
Parallelism allows the database to split operations across multiple processors. While this can dramatically speed up large queries, it adds overhead and isn't always beneficial for smaller operations.
Real-World Example
Consider a query that searches for orders from a specific customer in the last month. Without an index, the execution plan might show a table scan reading millions of order records. After adding a composite index on customer ID and order date, the plan changes to an index seek, reading only the relevant hundreds of records—a transformation from seconds to milliseconds.
Best Practices
Make execution plan analysis a regular part of your development workflow. Review plans for all important queries before deploying to production. Monitor production queries and regularly examine the most expensive ones. Keep database statistics current through regular updates or automatic maintenance. Test queries with realistic data volumes, as execution plans can differ dramatically between empty development databases and production systems with millions of rows.
Conclusion
Execution plans are your most powerful tool for understanding and optimizing database query performance. While they can seem complex initially, learning to read them transforms database optimization from guesswork into a systematic process. The investment in understanding execution plans pays dividends in faster applications, lower resource costs, and more scalable systems. Start with simple queries, gradually build your interpretation skills, and you'll soon find yourself instinctively recognizing inefficient patterns and knowing exactly how to fix them.